In previous article , part1, we have discussed about riemann installation and basic event sending from java application. In this article we will see riemann integration with Graphite. First lets discuss about why we need Graphite.
1) In Riemann the events are stored only till the TTL-time to live- value , we need something to store the events for longer term so that in future we can look at the statistics and get idea about system behaviour at the time of failure or error scenarios.
2) Riemann is stateless system and the riemann-dash board is also stateless. There are ways to store the definition of created dashboards but still they will show live data only.
While graphite has 2 great capabilities.
1)Storage
2)Easy and powerful dashboard UI.
Lets start with Graphite installation.

Lets integrate graphite with riemann.


As you can see Graphite has capabilities to store the metrics so you can configure time/date range. One more thing you should observe is Graphite creates new folder structure for each "." present in the service name. Here jvm.nonheap.memory folder structure you can see. So that you can organise and send your metrics accordingly.
What next you can do
Grafana is the next thing you can add in your framework. In simple word Grafana is a dashboard which can operate upon the data stored in Graphite storage. So basically Graphite will be there but Grafana can use Graphite's data and provide much much better and advanced dashboard options.
Explore more on this from here : http://docs.grafana.org/
Below is the updated architecture diagram:

So riemann processes the events and pushes the metrics data associated with events to Graphite for storage. Garphite stores it and display it on the dashboard. Grafana can leverage the data present with Graphite for further rendering.
That's it for now...
part3 is my next article on this series.
Please post your comments and doubts!!!
1) In Riemann the events are stored only till the TTL-time to live- value , we need something to store the events for longer term so that in future we can look at the statistics and get idea about system behaviour at the time of failure or error scenarios.
2) Riemann is stateless system and the riemann-dash board is also stateless. There are ways to store the definition of created dashboards but still they will show live data only.
While graphite has 2 great capabilities.
1)Storage
2)Easy and powerful dashboard UI.
Lets start with Graphite installation.
Graphite Installation
In this link you can see 4 different way of installing graphite and other component needed for it.
I am using 4th way : Installing From Synthesize
Synthesize provides script which automates installation of all necessary dependency and components needed for Graphite. But Synthesize installation method available for Ubuntu 14.04 version only. If you are using some other version and flavour of Linux than you should go with other way.
Installation steps for my case:
$ cd synthesize
$ sudo ./install
that's it !! Done!!
open Graphite dashboard in browser:

Lets integrate graphite with riemann.
Riemann Graphite Integration
Open riemann.config file. In my case it is located at /etc/riemann/riemann.config
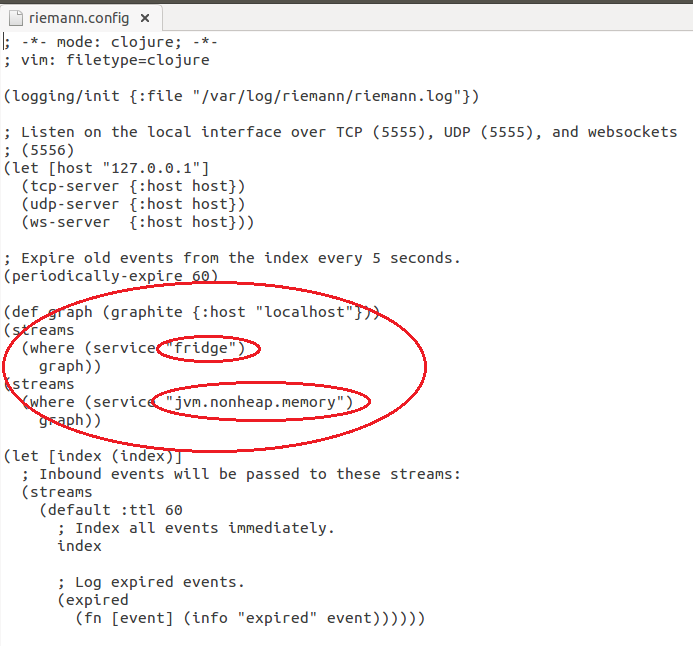
The red part I have highlighted is the newly added config for Graphite.
First I have provided location of Graphite VM. In my case it is the same machine so I am using localhost.
The next thing is stream processing rules.You can specify which services you want to render on Graphite. Here I am declaring both "fridge" and "jvm.nonheap.memory" service to render on Graphite dashboard. We have created this services in part1.

What next you can do
Grafana is the next thing you can add in your framework. In simple word Grafana is a dashboard which can operate upon the data stored in Graphite storage. So basically Graphite will be there but Grafana can use Graphite's data and provide much much better and advanced dashboard options.
Explore more on this from here : http://docs.grafana.org/
Below is the updated architecture diagram:

So riemann processes the events and pushes the metrics data associated with events to Graphite for storage. Garphite stores it and display it on the dashboard. Grafana can leverage the data present with Graphite for further rendering.
That's it for now...
part3 is my next article on this series.
Please post your comments and doubts!!!
No comments:
Post a Comment